
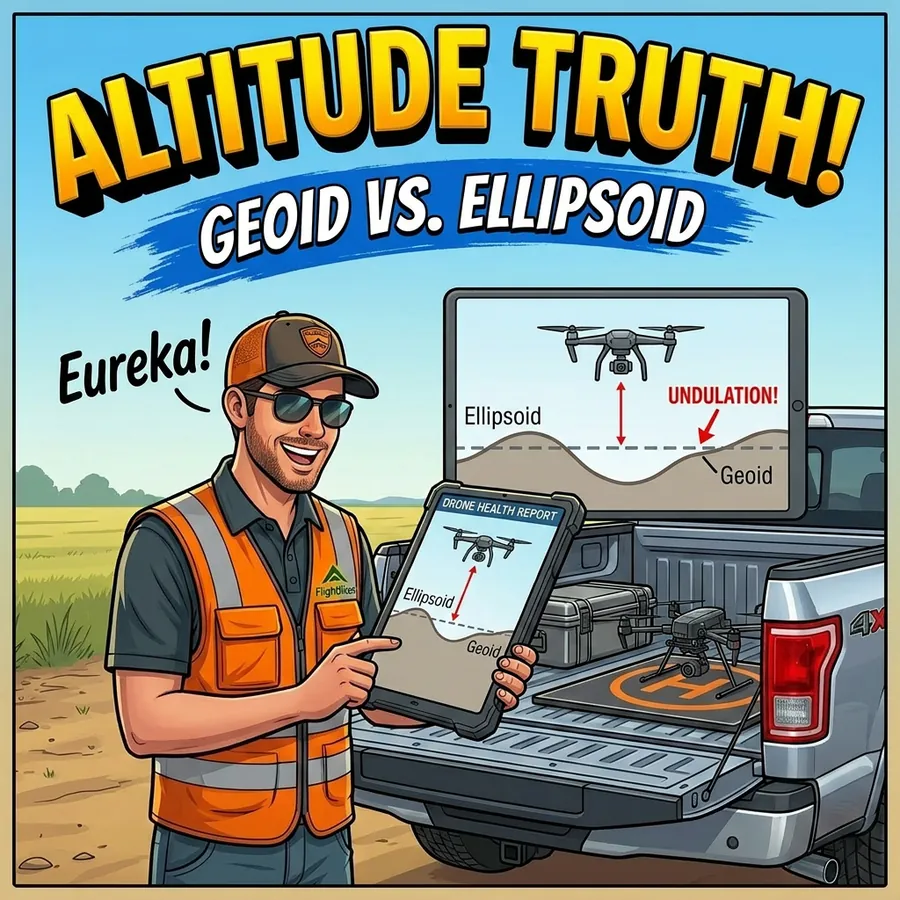
Your drone records altitude relative to the WGS84 ellipsoid — a smooth mathematical model of the Earth’s shape. Google Earth renders its terrain surface relative to the geoid — a model of the Earth’s gravity field that approximates mean sea level. These two reference surfaces don’t line up. The vertical gap between them at any given location is called geoid undulation, and if you don’t account for it, your camera icons in Google Earth will appear to float above or sink below the ground surface.
In the Gulf Coast region of Louisiana, for example, the WGS84 ellipsoid sits approximately 27 to 28 meters above the geoid. A drone hovering at what its GPS reports as 3 meters of altitude appears at roughly -25 meters in Google Earth — effectively underground. The correction isn’t a workaround — it’s a required step for accurate spatial visualization.
What Doesn’t Get Changed
It’s important to understand what the altitude correction actually modifies. The drone’s raw GPS measurements are preserved exactly as recorded in the KML’s extended data block. The absolute altitude value embedded by the drone, the AGL altitude from the barometer, the original EXIF record — none of these are touched. The correction applies only to the coordinates element in each photo’s placemark, which is the value Google Earth reads to position the camera icon vertically on screen.
What changes is where Google Earth draws the icon. What doesn’t change is the underlying GPS record. If a digital processing team opens any photo’s placemark balloon in Google Earth, the raw measured values are there, unmodified, in the extended data.
FlightDeck’s Geoid Calculator
Manually calculating geoid undulation requires geodetic data and formulas that most commercial UAS operators don’t have in their normal workflow. FlightDeck automates this using GCP data from Aeropoints.
When you conduct a ground control point survey with Aeropoints equipment, the exported CSV contains both the GPS-derived ellipsoidal height and the orthometric height (height above the geoid) for each control point. The difference between those two values at each point is the geoid undulation for that location. FlightDeck’s Geoid Calculator reads your Aeropoints CSV, computes the undulation at each GCP, and returns the mean value across all points — along with the standard deviation, minimum, maximum, and point count.
That mean value is what you enter as the Altitude Display Offset in the QC Uploader’s KML tab. The calculation takes seconds. The alternative — looking up geoid undulation values in NOAA’s geoid model tables and averaging them manually — is the kind of step that gets skipped when it shouldn’t be.
Reading the Calculator Output
The summary from the Geoid Calculator shows you more than just the mean. The standard deviation tells you how consistent the undulation is across your survey area — a low standard deviation means the offset applies evenly across the site; a high one suggests terrain variation that may cause some icons to appear slightly off even after correction.
The geoid model name (typically GEOID12B or GEOID18 for most U.S. operations) is recorded from the CSV header. If the Aeropoints file was exported with height values in feet rather than meters, the calculator detects this and converts before computing the undulation.
Why This Matters for Deliverables
For tower inspection work specifically, the Altitude Display Offset is what makes a KML deliverable look professional. Camera icons at the correct elevation above Google Earth’s terrain surface give reviewers an accurate visual of where the photos were taken relative to the structure. Icons floating 27 meters in the air, or buried underground, tell a different story — and one that raises questions about data quality regardless of whether the underlying GPS record is perfectly accurate.
The Geoid Calculator in FlightDeck is the step that connects your survey data to a visually accurate deliverable. It’s included in every license tier.